Observed environments
Explore sounding-derived wind profiles from Goshen, Prospect Valley, Dumas, and Moore — or a prescribed demo profile — inside a controlled kinematic laboratory.
An interactive 3D scientific-computing laboratory for exploring how observed atmospheric wind profiles and prescribed storm-relative flow shape passive-tracer trajectories and vertical-vorticity tilting. Built around real sounding-derived environments from Goshen, Prospect Valley, Dumas, and Moore, the project combines interactive visualization, trajectory analysis, historical-sample inspection, and explicit diagnostic validity checks. It is a controlled kinematic experiment — not a weather forecast or a full atmospheric simulation.
Interface preview
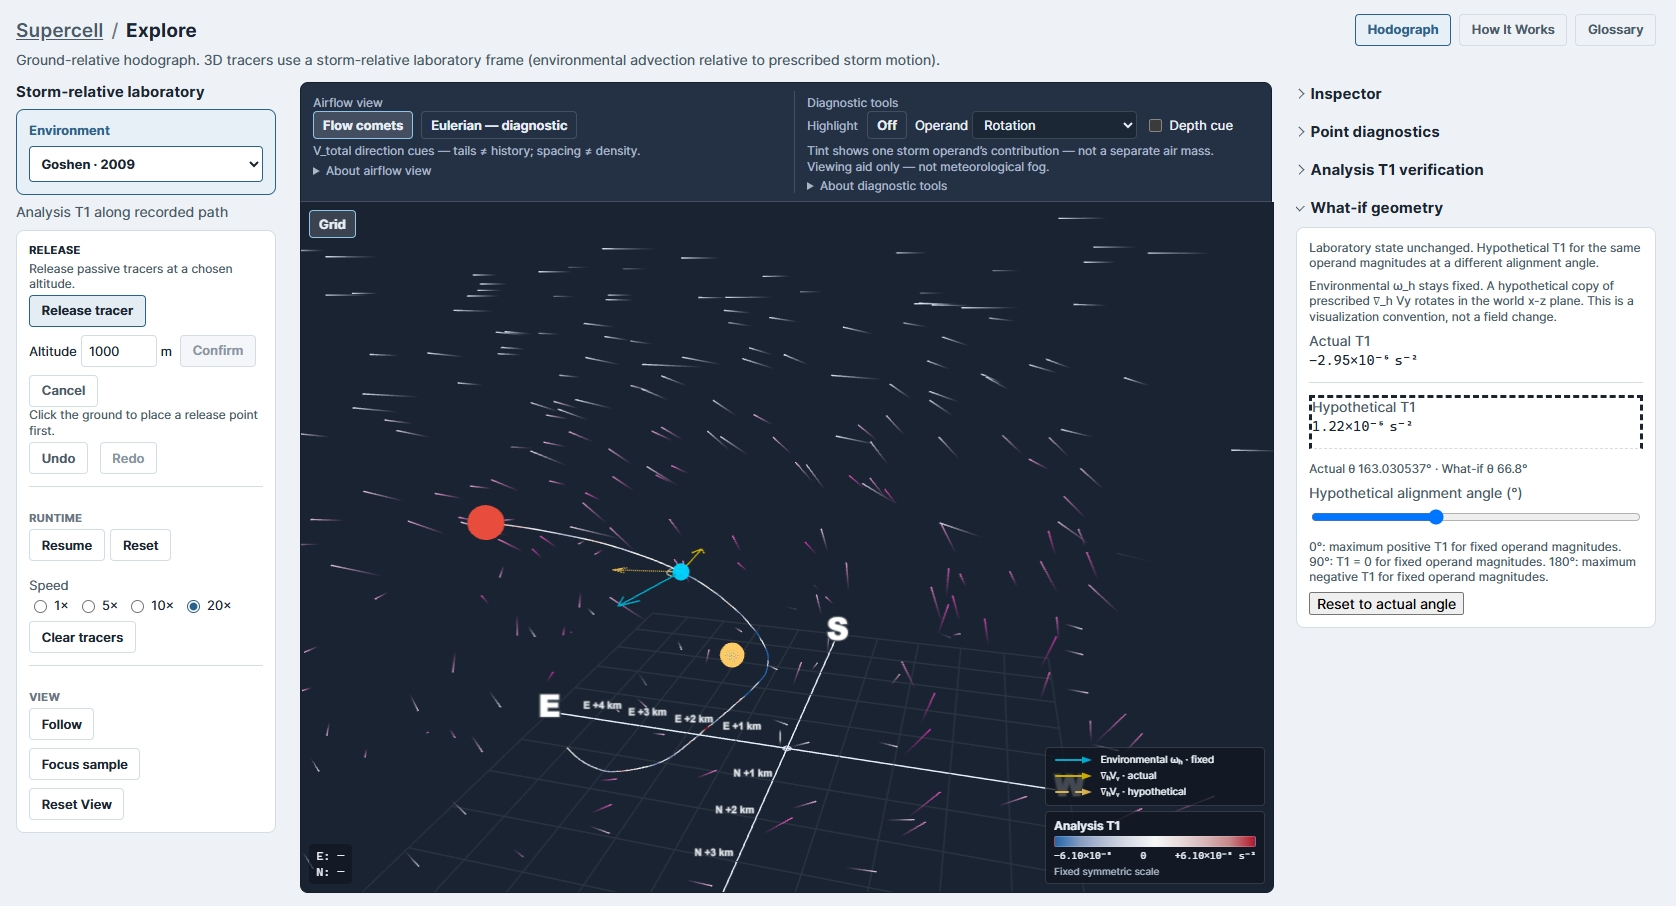
A look at the project in real use.
Value
Explore sounding-derived wind profiles from Goshen, Prospect Valley, Dumas, and Moore — or a prescribed demo profile — inside a controlled kinematic laboratory.
Release a passive tracer, record its path through prescribed storm-local flow, and see how environmental wind and storm-relative geometry shape the trajectory.
When an Analysis representation is available, read the vertical-tilting diagnostic on a fixed symmetric color scale along the recorded trajectory — not as a forecast, but as an inspectable signal.
Click a historical sample to inspect environmental horizontal vorticity, prescribed updraft-gradient geometry, numeric verification, and a constrained what-if alignment.
The lab does not model a self-evolving supercell, thermodynamics, or storm reconstruction. Observed soundings are inputs to a prescribed kinematic experiment, not proof of a real storm simulation.
Audience
Atmospheric science students and researchers curious about tilting mechanisms in a controlled setting
Engineers interested in scientific visualization, 3D diagnostic UIs, and honest model boundaries
Anyone who wants to inspect storm-relative flow as a laboratory, not as a weather forecast
Developers interested in complex frontend architecture bridging interactive 3D, scientific data, and diagnostic computation
Follow a tracer through observed environments and inspect why the tilting diagnostic changes along the path. Desktop recommended for the full 3D experience.